Showing posts with label visualization. Show all posts

Monday, 7 July 2014

Book: The social atlas of Europe

www.europemapper.orgSee Europe as never before!

The social atlas of Europe
Dimitris Ballas, University of Sheffield
Danny Dorling, University of Oxford
Benjamin Hennig, University of Oxford

"An insightful look at today's Europe - through the underlying realities that Europeans live every day, all brought to life in charts and maps that reveal the human geography of this vitally important area of the world." Robert B. Reich, University of California at Berkeley.

The social atlas of Europe is the first human geography atlas to consider the European economy, culture, history, human and physical geography as a single land mass and a more unified European people. It provides an accessible overview of Europe and a human geography contribution to debates about a wide range of topics. It includes:

- Maps on over 80 topics ranging from life expectancy, greenhouse gas emissions to Eurovision Song Contest voting patterns
- Uses innovative full colour visualisation methods
- Explores Europe's society, culture, economy, politics and the environment
- State-of-the-art Geographical Information Systems (GIS) and new human cartography techniques

More information about the book is available on its website www.europemapper.org

Available at the special price of £19.99 (plus p&p) at www.policypress.co.uk/display.asp?K=9781447313533
Kathryn King
Marketing Manager
Policy Press, University of Bristol
6th Floor, Howard House, Queen's Avenue, Clifton, Bristol BS8 1SD
Tel: +44 (0) 117 331 5369
Email: kathryn.king AT bristol.ac.uk

My source: EUROPEAN-SOCIOLOGIST list at JISCMAIL.AC.UK

Wednesday, 4 June 2014

Would you let a robot take your blood?

A Robot With A Hypodermic Needle 

Written by Lucy Black
27 July 2013

Would you let a robot take your blood? The answer to this question illuminates our real relationship to machines that aspire to rise above the robot vac. Is there another sort of uncanny valley?

Veebot is a very clever use of some basic image processing plus some very accurate positioning mechanisms. It first locates a good vein using infrared. Once it has a target it switches to ultrasound to make sure that there is enough blood flow to make it worth inserting the needle.

More...


My source:
International Society for Presence Research: June
http://ispr.info/


individual
INTERPERSONAL : SCIENCES
humanistic ------------------------------------------- mechanistic
SOCIOLOGY : POLITICAL
group
trust, confidence, anxiety, expectations, 'needles' - phobia, previous experiences, model of the 'other', intelligence, physical tests to differentiate mental health problems, subjective feelings - 'creepiness'
human
pa
safety, measurement, imaging, mechanics, technology, electromagnetic spectrum, infra red, ultrasound, motion, accuracy, research, trials, evidence, logic, blood sample,  appearance, (surgical robots R-here)
factors
in             RFT - 'right first time'
public awareness, interaction, relationships, community of practice - acceptance, publicity, media, dissemination
investment, policy, certification, law, standards, testing, supervision, labour relations

Saturday, 12 April 2014

Making learning visible dodging bullet points

Since January and the start of the course in Technology Enhanced Education there's been - and still is - a lot of reading to do. I've gained new and renewed insights into possible research methods and I'll share some of this in the next few weeks. The figure below is from:

Hay, D., Kinchin, I., Lygo‐Baker, S., 2008. Making learning visible: the role of concept mapping in higher education. Studies in Higher Education. 33, 295–311. doi:10.1080/03075070802049251

Figure 4 from Hay.
Over the years I've noticed and been rewarded when after a session on the care domains model some audience members have commented that the exercise made them think. There's nothing special in that of course, simple maths makes me think. Perhaps, people felt relief for a change from the passive absorption of facts, images, acting as static targets for a slew of bullet points. What comes across though is that there was some effort involved. In the figure above we can imagine the energy needed to not only create new and maintain existing concepts, but reject others. This might also constitute one front of the theory - practice gap?

This in a way reflects my thinking that although we refer to person-centred care in theory, practice and policy, this does not automatically follow. Person-centredness should take effort, work and energy. If that is the case, it also needs time.

Thursday, 20 March 2014

[c/o hipnet] Data Visualization Enthusiast? Join us on the Data Viz Hub!

Dear Colleagues

The recently launched Data Viz for Development Hub [http://datavizhub.co] is a vibrant community for sharing resources, tools, examples, and ideas about data visualization. Using graphs, charts, maps, tables, infographics, and other visualizations can improve how we communicate information to stakeholders and the larger development community. With a wealth of resources available, and a growing interest across international development practitioners to build effective visualizations, the Hub will help keep communicators, evaluators, developers and others in the know about data viz best practices and new tools, connecting visualizers from all domains of expertise.

Check out the Hub at datavizhub.co, and join the community listserv by emailing:
dataviz AT knowledge-gateway.org with the subject "Join." We look forward to connecting with you about all things data viz!

Questions? Contact Libby Skolnik at libby.skolnik AT jhu.edu

Source: http://www.hipnet.org/

Saturday, 1 March 2014

Drupalcamp London 2014: The Government Digital Service, Drupal 8 Multilingual features, Twig

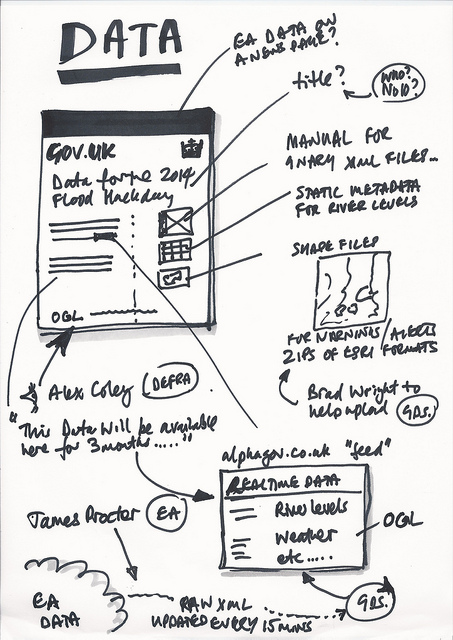
https://gds.blog.gov.uk/2014/02/23/flood-hack-developing-solutions/
Flood hack
DrupalCamp London today got underway with a keynote Delivering User-centred Digital Services by Mark O'Neill from the UK Government Digital Service.

Given the record of public and private sector led IT projects it was refreshing to hear of the GDS's approach being user-centred, the extension of 7 design principles and Mark's previous experience. It's clearly too late for the health care sector to coin and create the Needotron - GDS beat us to it.

Drupal 8 is looking formidable both in its potential and the (learning) stack it presents. Another great session to pick out was - A whole new world for multilingual sites in Drupal 8 by Gábor Hojtsy. The progress here is phenomenal and even though incomplete it is a major achievement and a credit to the Drupal community.

It's humbling as it reminds me to post some introductions to Hodges' model on W2tQ in several languages.

As to being user-centred, the Harmony Forum is a real tease. I know a forum will not moderate itself (is that the new Sorcerer's Apprentice?) and yet time is of the essence. Harmony is one for me to watch - so I'm signed up for the newsletter. Two sessions on Twig and Entities rounded up a busy few days.

This began on Thursday with Cutty Sark, the Royal Greenwich Observatory (learned much from their interactive designs), Turner and the Sea, The British Library - Beautiful Science (60-90 mins ample), and Ibsen's Ghosts at Trafalgar Studios.

I was also able to visit a university yesterday and meet a member of faculty who used Hodges' model many years ago. Here's hoping that some of the materials can be retrieved even though it seems unlikely. I hope to keep in touch with this nursing contact (and not just for the dinner!). I've met several other people here, the Drupal community is another great asset - and with thanks to the sponsors who make these events feasible for many of us.

Output from Needotron


I'll end this post back with Mr O'Neill and the GDS.

I wonder to what extent healthcare figured in the flood deliberations?

It seems that an output from the Needotron may not be so far removed from h2cm?

Happy St David's Day too - in the closing minutes here!


Saturday, 28 September 2013

Drupalcon Prague: sessions, missed ops, leaflets and old contacts - renewed

The structure of Drupalcons provide a range of sources for learning, networking and information. The main sessions are the most obvious source, plus there are many vendors providing and marketing various services from development, hosting to specialist services. Less formal there are the Birds of a Feather BoFs, core conversations. I did not get to any BoFs, it is always difficult when these things run concurrently.

I'll list here some things that stood out from leaflets left on the coffee tables to BoFs that clashed (I've revisited the program). First up is a BoF that points to a useful bundled project:

Creating Graphs and Maps with SearchAPI

BoFs, being informal are quite dynamic so the lesson for me is to check the program for additions and things you may have missed. I missed a BoF on e-learning in Drupal, the Quiz and related modules - H5P that I posted about last May. Gutted for sure, as I can envisage how I could use these tools beyond the old HTML multiple choice form.

The above BoF included a demo of Opigno an LMS - learning management system.

As to companies, the Semantic Web Company offers Drupal services. This lead was a flyer I picked up on the last day and another prompt to revisit Neologism a Drupal project I came across in Drupalcon Szeged, Hungary in 2008 and posted about. The introductory text from the DERI Neologism website reads:
Neologism is a vocabulary publishing platform for the Web of Data, with a focus on ease of use and compatibility with Linked Data principles. Neologism is free and Open Source.
With Neologism, you can create RDF classes and properties, which are needed to publish on the Web of Data. Neologism makes creating and publishing vocabularies easy and fast. It supports the RDFS standard, and a part of OWL.
Among a great many people, I met Alan Burke in Szeged back in '08 and he re-introduced himself this week in Prague. He is now full-time dedicated to Drupal and was pleased to learn that as an 'enthusiast' I am still engaged. I qualified this - with a website still to do; but yes, I'm very much still on-board. I really appreciate Alan's coming over during the break and hearing of his progress and that of his colleagues.

Scalability is a common discussion in software. Scale is an issue for new businesses also. One of the sessions in Prague (several probably) drew attention to the complexity of the 'Drupal stack'. Is it possible for an end-user to fully master it? In our quick chat it became apparent that this was partly why Alan was pleased to learn that I am still climbing the curve. Scalability can be a problem for individuals too, as in making sense of the commercial offerings, whether semantic services or hosting.

There was a BoF on data visualization too - but again I was elsewhere. Dataseed sounds an interesting fusion. I also followed sessions on creating multilingual sites, Drupal 8, Symfony, plus Twig the new templating system for Drupal 8. All in all it was a great event with some sight seeing last Monday. The greatest source though is the community!

Saturday, 8 June 2013

New Scientist: Article on Cotard's syndrome [ and Hodges' model ]

Nine years ago, Graham woke up and discovered he was dead.

He was in the grip of Cotard's syndrome. People with this rare condition believe that they, or parts of their body, no longer exist.

... more
INTERPERSONAL : SCIENCES
SOCIOLOGY : POLITICAL

individual
Cotard's syndrome
Belief    "I am dead"   delusion (or?)
depression      self                                   suicide
 "I have no brain"    theory of mind         consc
psychotherapy           
                senses - taste smell
PET - positron emission tomography
ICD 11 - classification?
 attempts               'default network mode'
iousness          body (parts)        brain function
frontal and parietal lobes  anaesthesia
 low metabolic activity   physiology 
social impact, family, friends, carers
sense making  social understanding
stigma      interview
Jules Cotard (1840–1889), a French neurologist
media      unemployment
quality of life   autonomy   control
research funding      access to treatment
specialist services     referral processes
group - population


Source: New Scientist, 1 June 2013.
Mindscapes: First interview with a dead man

Wikipedia: Cotard delusion

Sunday, 2 December 2012

FatFonts - fonts with real weight: Giving space and data form

How it works (from fatfonts.org):

Fatfonts are designed so that the amount of dark pixels in a numeral character is proportional to the number it represents. For example, “2″ has twice the ink than “1″, “8″ has two times the amount of dark ink than “4″ etc. You can see this easily in the set of characters below:


Source for the above and animated: http://visual.ly/fatfonts-player?view=true

My source: Jacob Aron, Making numbers punch their weight, New Scientist, 5 May 2012, 214, 2863, p.12.

Saturday, 14 July 2012

Gestalt, patterns and models: pressing buttons

The three recent events have all in different ways emphasized the role of patterns.

Patterns were there at the Drupal Education Camp, then the Visual Methodologies Workshop and the Scottish Ruby Conference.

There is a lot of very informative content in .net magazine. In the two most recent issues a single page has proved a great help (Buttons gestalt, .net August 2012, p.74) and in the current issue (.net Summer 2012) page 72.

Gene Crawford notes that gestalt in graphic design refers to how a person will recognise and react to an element of something we've designed. Buttons are discussed as an essential part of any design. Crawford points out how a button is the end point in submitting a form, completing an action, or transaction of some form.

A button has to fit in with an overall design - so that as an individual element it shouts out its function, its potential; whether or not that potential is realised.

In case of a medical emergency there is only one button to press: that which activates emergency procedures.

When we are concerned to deliver health and social care the button we should press is: Hodges' model. This is a compound operation. One press activates four (five) buttons: four care domains. This is the umbilicus, not just the nexus, the physical 'belly' button, but the mind, the social, political and spiritual.

For holistic, reflective and integrated care viewing h2cm as a button begs we contemplate the potential that lies beneath. Beneath in the sense of what follows after the button is activated. This is precisely Gene's focus in the summer 2012 issue of .net Mental Models on page 72.

He points to a book: Mental Models Aligning Design Strategy With Human Behaviour, which I also learned of from a lady staying in Lund at the same B&B. Here the thought processes of a visitor to a web site are central. I have some old content - archive material, but vital and still central to understanding and the history of h2cm. How are visitors to navigate their way to find original content, what mental model do they bring even before they seek out menus and buttons. What expectations will they associate with the words and vocabulary of the website: Hodges' model, conceptual framework, structure, content, and conceptual spaces?

I often think of h2cm as a care (information) architecture and Crawford notes the need for empathy with users as a website is designed. So, closer than ever these worlds: nursing and websites. ...

Wednesday, 20 June 2012

Visual Methodologies Workshop in Newcastle

After Oxford Drupal Education Camp this Friday-Saturday proceedings move on to a NE workshop.

If your focus is on person-centered health care then the volume of data involved that pertaining to the individual can be readily apprehended. At least the example of a single episode of care. Of course, there are exceptions, people who might be the subject of special case studies so complex is their condition and pathology. Data volumes do vary markedly from person to person. A great deal of generated data in an individual instance might be taken for granted. In the reported findings, for example, of an MRI scan that is included in a referral. When provided existing diagnoses do much to enrich the information and knowledge contained in a referral, whilst reducing possible avenues for further data gathering.

Once we move from individuals to groups and populations then the volumes involved quickly become massive. Purposes and context reflect this change in scale; codified, anonymised, aggregated the individual is lost.

Both my day-to-day work and study of Hodges' model (in nursing, informatics, literacy...) are centered on individuals. 'Caseness' in a clinical word: a referral, home visits for the day, face-to-face interaction, care concepts in assessments, plans. ... Then there is envisioning a nurse-patient (carer) interaction, or individual's episode of care through Hodges' model. As per the model's structure, however, groups and populations must also be represented. This duality of personal and data scales makes this workshop on visual methodologies of instant relevance. The two days next week cover (with my emphasis):
Introduction to working with visual methodologies: understanding epistemologies and disciplinary boundaries
  • Mapping
  • Story-boarding
  • Artefacts
Quality in visual methods: ethics, validity and reliability
Doing visual methods: lived examples of managing data capture, synthesis, analysis and dissemination
Modes of analysis: focusing on methodological and epistemological influence on the research process

Workshop part 1: working with self-created data
Workshop part 2: creating shared analytic frameworks for self-created data
Overarching ideas and ways forward for thinking about visual methodology
Hodges' model can be readily interpreted and presented as a map and a series of story boards. The model can also support analysis, synthesis: well, this is my belief that is shared by some people.

I have completed modules on research methods, but it seems increasingly that research methods, methodologies, data structures and algorithms overlap. It may be that advances in media, technology, data gathering and improved access to data sets is having this effect. Perhaps more integrative and open attitudes (interdisciplinarity) towards quantitative and qualitative research also accounts for this blurring; or it could just be me? Whatever is the case, I'm really looking forward to the programme, meeting the facilitators and students. I am hoping this will inform my project as per the aims of the workshop:
  • Consider the role of visual methods in data collection, research ethics, synthesis, analysis and dissemination;
  • Explore the theoretical prospectives, epistemological traditions and latest practices that have shaped the development of visual methodologies; and
  • Enable participants to translate how visual methodologies can be used to support their own research.
I'll try and post from Oxford this Friday - Saturday and from Newcastle next week. From Newcastle I'll be heading to Edinburgh for the Scottish Ruby Conference. Lots to follow as I put 10 days unpaid leave to use.

Thursday, 7 June 2012

Reflections [V] Conceptual Spaces At Work: Zwarts

As per previous CS@W posts Joost Zwarts' Constructing Conceptual Spaces for Lexical Semantics provided one of several examples at the conference of data analysis derived from large datasets. The abstract included:
The similarity structure of a conceptual space can be determined using lexical data or pile sorting, but it can also be based on some sort of analysis of the values involved. Using the work of Geeraerts et al. (1994) on Dutch clothing terminology, Zwarts (2010) demonstrates how a space of “shirts” can be constructed (either using graph or MDS techniques) along such lines, with fruitful results.  
This talk outlined the way features can be identified and decomposed. Key to this are classifiers which Zwarts listed as:
1 Psychological classifiers (piles)
 From similarity judgments or sorted piles
2 Lexical classifiers   (words)
 From common lexical descriptions
3 Analytical classifiers  (features)
The presentation provided a small example based on containers, which for me was very helpful as data is a real issue for my study of Hodges' model. There are datasets out there - nursing, classification systems - and secondary data sources to consider. As mentioned above Zwarts took a dataset comprised of 38,000 possible items from the clothing domain and used 244 from the sub-domain of shirts. [Geeraerts, Grondelaers, Bakema (1994). The Structure of Lexical Variation. Berlin: Mouton de Gruyter. ]

I am probably simplifying things but discussion of Hamming distance recalled for me old Byte articles on bit-classifiers. Whether a sign of progress (maturation) or my focus, but in the 1980s there were many articles on data structures and algorithms, for some reason quad trees proved quite an attraction. There was an approach to clinical classification by Johnson (1987) that adopted a ZIP code format. As Zwarts related his presentation I wondered where a primary care problem might reside in Hodges' model: (1000, 0100, 0010, 0001)? Alternately where is the emerging problem that is nudging this individual towards possible relapse?

Graphviz was used and multidimensional scaling. The talk became more technical, understanding aided by graphical examples as classical categories were introduced: A category C is classical iff it can be defined by a particular set of feature values. The conclusion brought together the technical aspects of the data examined: convexity is too strong, connectedness somewhat too weak, but that there is a clear notion of coherence. There was much here to learn from.

Johnson, B. (1987) Health Code, The Guardian, 23 July, 16 (see also (1990) Journal of Health Care Computing).

The following page is out of date but cites Johnson:
http://www.p-jones.demon.co.uk/infselct.htm

(I don't want to upset searches on Google for 'conceptual spaces', so I've two more further posts this month on the conference concerning CSML and OntoSpaces.)

Here is the view from my B&B I enjoyed some lovely walks into Lund, plus using the bus. With a map that stayed in my laptop bag, I enjoyed getting lost on two occasions.


Wednesday, 30 May 2012

Reflections [III] Conceptual Spaces At Work: Lund University, Sweden, May 2012

The next session - Event Structure, Conceptual Spaces and the Semantics of Verbs Peter Gärdenfors, Massimo Warglien & Matthijs Westera, was presented by Peter Gärdenfors whose book Conceptual Spaces (2000) I bought in Sedbergh in 2008 (talk about serendipity!).

Just reading the title back then was enough...

There was a starter question: Why are there word classes (nouns, verbs, adverbs...)?

It became evident that first morning that conceptual space as a representational form is very much still in active development. The abstract begins:
The aim of this paper is to integrate spatial cognition with lexical semantics. We develop cognitive models of actions and events based on conceptual spaces and vectors on them. The models are then used to present a semantic theory of verbs. ...
Word classes were related (as in the book) to conceptual space elements, e.g.

nouns - categories
adjectives - properties

In addressing verbs this paper seeks a two-vector model of an event.

Agent (Force) -> Patient (Result)   - result verbs describe the change in the object.

The Professor said that cognitive and linguistic aspects are often confused. Two theses were also provided - thesis 2: single domain constraint.

In addition talk of several spaces might be troubling (adding complexity), but to me the prospects of action space, category space and physical space makes the potential for modelling more explicit and accessible to Hodges' model.

I scribbled down 'agent not always necessary (fall, growth?...)' and pondered about self-care, relatives acting as a proxy.

There was a lot of detail on language, linguistics: static verbs, intentional verbs -> physical action; telic verbs. ... Rather than feel (completely!) confused by this specialist talk, I felt enthused for what is to follow.

Reflections [II] Conceptual Spaces At Work: Lund University, Sweden, May 2012

[See also Reflections I CSaW2012]

Among many things Dessalles - From Conceptual Spaces to Predicates - told us that meaning is essentially two-fold: analogue and symbolic.

An evocative summary was provided:

(Topo)logical thinking = Conceptual spaces + Contrast

Concepts do not exist as permanent structures.
Predicates are ephemeral.
Questions included: Is there a contrast logic?

You can find Dessalles online and there is a specific book Why We Talk (2007) (some of the chapters look particularly interesting - information).

Also to investigate are there being no locality principle and the danger of holism, and a point about structural matching as part of problems with traditional approaches to meaning that involve interfaces and relationship structures (pardon the ramble - the paper has not appeared yet).

Geuder's Manner Modification and the Representation of Event Concepts found me tweeting - see below. A biomotion demo was tied to the theme emphasizing perceptual cues, manner and meaning.

Off at a tangent the title had me musing on the importance of 'manner modification' in nursing. Sometimes fleetness of attitudinal, objective and emotional foot is needed to deal with a care situation. Tangent aside, there are clearly some serious considerations around health care processes, these are the bread and butter of healthcare records and information systems.

I've just copied my tweets (clinical examples arose in several sessions):
Gardenfors & Warglien ref new paper?* subspaces corres to a division into domains - event concepts

Manner modification eg. "slowly". (Manner central in health nursing) +mention of forgetting + absentmindedness denotes? PTSD?

A representation of a stage structure is needed - further e.g. "carefully" He cleaned the wound... filled by context (as ever)
Geuder still, now on emotional state predicates - "sadly" Three possible ways to proceed - close now

* The following may be the new paper:
Peter Gärdenfors and Massimo Warglien Using Conceptual Spaces to Model Actions and Events. J of Semantics first published online April 17, 2012 doi:10.1093/jos/ffs007


Tuesday, 29 May 2012

Reflections [I] Conceptual Spaces At Work: Lund University, Sweden, May 2012

I started writing up and reflecting on my notes while still in Lund on Saturday evening 26th May. As I passed the taxi rank returning to my B&B I knew Eurovision had started: Englebert sang out. It was quite novel to be in Sweden that night.

The conference was excellent.
Lund is a beautiful, friendly city and the weather was amazing.

I am so pleased I made this journey and would like to thank the organisers and sponsors for their work and support. The conference was free to attend, which greatly assisted me. Speakers were in the majority which added to the event's value for me (and the other participants). Some of the presentations included maths and logic, but as I was advised initially I could follow the gist of all the presentations and the details of many.

If you are a nurse, social worker, occupational therapist... and you read through these follow-up posts you may well wonder how is this relevant to healthcare? Well at the moment that is unclear, but I'm sure there is a connection. I'll share some tentative connections here and add some photographs over the next few weeks or so. As I review my scribbled notes I may have made some mistakes, missed out key points and references are still appearing, but here goes ...

The first session on Thursday was by Carita Paradis, who presented White aromas and subtle oak spices: From sensory experiences to language through conceptual spaces. Carita's focus was wine tasting with its four sensory modalities of VISION, SMELL, COLOR, and TASTE and a descriptors list for the properties of wines, such as sharp, soft, lemon and cherry. There is a corpus as the paper explains:
... the source of data used in this investigation is the American wine magazine, the Wine Advocate. The corpus contains 84,864 wine reviews published 1989 – 2006. The total number of words used is 8,332,666 and the number of different words is 46,000 (for more information about the corpus as such and an interactive information visualization (InfoViz) tool to be used to retrieve different kinds of information about the wines reviewed, both linguistic information and metadata, ... p.4.
In addition for both red and white wines there is an aroma wheel. It was helpful in the Q&A at the end to be reminded of the relative dominance of the senses. Questions had me recalling the emotional and reflexive response of disgust and how this is 'hardwired' - the limbic system and connected to other senses. The findings of a lower to higher directionality in modalities - touch through to sound and vision and the use of metaphors and the direction of these: soft light OK but not light softness was fascinating.

So, there are more reasons for a blog post than the four senses referred to by Carita. What descriptors are there for the four care domains (interpersonal, sciences, political and social)? How can they be discovered (or recovered)? Where is the corpus for nursing? Is there a secondary source? Is there a case for a different approach? Are there several in the form of nursing classification and terminology systems?


As to the other sense: I also wondered about the sound of money and advertising (of alcohol), generally more tightly controlled in Sweden as I understand, especially advertising aimed at children.

Carita Paradis & Mats Eeg-Olofsson, Describing sensory experience recontextualization through properties, objects and imagery in discourse, Lund University

Thursday, 3 May 2012

Visual Methodologies Doctoral Training Workshop 26 - 27 June 2012

Developing Theory & Practice in Visual Methodologies


The School of Education, Communication & Language Sciences and Durham University’s School of Education are holding a two-day workshop for doctoral students on the development and use of visual methodologies.

The workshop will take place on Tuesday, 26 June and Wednesday, 27 June 2012 at Newcastle University.

Further information about the workshop and how to register can be found at:

http://www.dur.ac.uk/education/postgraduate/visualmethodologies/

The workshop is part of the North East Doctoral Training Centre’s (NEDTC) annual programme of advanced training in the social sciences.

Please do not hesitate to contact Anne Parks ( NEDTC Secretary email a.l.park AT durham.ac.uk ) if you need any further information about the event.

My source:
ESA-ALL at JISCMAIL.AC.UK

Monday, 13 February 2012

Leonardo: models, limbs and spirit


On the 3rd February I headed off to London for the weekend to visit the National Gallery with (two) tickets for the Leonardo exhibition. This was an amazing experience on the Saturday afternoon. The exhibition was small in terms of room sizes and across two floors, but it was very busy and warm even with timed ticketed entry. The show comprised much more than the main exhibits; the drawings, several inspired works by Leonardo's students and audio commentary adding context. Text descriptions and several quotations also proved informative:


A good painter has two main objects to paint, man and the intention of his soul. The former is easy, the latter hard as he has to represent it by the attitude and movement of the limbs.

Leonardo da Vinci


animation by peter jonesAdditional links:

Nursing: Art and Science ... Fra Angelico to Leonardo

Visualization & Diagrams

Catalogue image source:
http://www.nationalgallery.co.uk/products/leonardo_exhibition/leonardo_da_vinci_exhibition_catalogue/p_leonardoEC

Saturday, 11 February 2012

Call for chapters - Human centric visualization: Theories, methodologies and case studies

[Shortened for length from original post to ubicomp.org]

*** CALL FOR CHAPTERS  ***
Proposal due: Feb 24, 2012
Notification due: March 09, 2012
Full chapter due: June 15, 2012

A book edited by Tony Huang (CSIRO ICT Centre, Australia), to be published by Springer: www.springer.com
Web: http://www.wikicfp.com/cfp/servlet/event.showcfp?eventid=19780%A9ownerid=14065

1. Introduction
Visualizations (diagrams) are produced for people to make sense or interact with them. Rapid advances in display technology and computer power have enabled researchers to produce visually appealing pictures or compelling visual environments to end users. However, the effectiveness of those pictures in conveying embedded information to the users and impact of visual environments on humans have not been fully understood.
This book addresses issues related to design, evaluation and application of visualizations from a human centric perspective. This cutting-edge book is an edited volume whose contributors include experts worldwide, from diverse disciplines including psychologist, artists, engineers and scientists.
Academics, students, engineers and consultants will find this book useful for both research and engineering purposes.

2. Recommended topics include, but are not limited to, the following:
Part I: Introduction and overview

Current status and future challenges of visualization methods
Current status and future challenges of human centric visualizations research
Survey of evaluation methods in visualization
Survey of theories, frameworks, models, heuristics and design principles for visualization

Part II: Theories, models, frameworks, heuristics and design principles for human centric visualization

Theories of visual thinking, diagram perception, cognition and reasoning and their applications
Latest developments toward theories of visualization
Latest development of frameworks, models, heuristics and design principles for visualization
Applications of the theories, frameworks, models, heuristics and design principles
Adaptations and applications of theories from other domains in visualization

Part III: Methodologies for design, development and evaluation of human centric visualization
Approaches and practices of visualization design
Evaluation methods
Measurement metrics
Taxonomies of tasks
Design and evaluation frameworks
Development and validation of methodologies
Application of methodologies
Lessons learned and experience obtained in developing and applying methodologies

Part IV: Case studies of human centric visualization

Human factors (e.g., memory, cognitive ability, gender, individual differences)
Visual perception and cognition
Visual analytics
Social, cultural aspects of visualization
Implications of new technologies (e.g., displays, new media) on humans
User experience
Implications of interactive methods on humans
Implications of new visualizations on humans
Roles of human in collaborative visualization
Use of visualizations for decision making, learning, business, software engineering, science, security, biology, design, construction, cartography, etc.
Visualization in virtual reality/mixed reality/augmented reality
Case studies and evaluations of interfaces, systems and prototypes of visualizations
Lessons learned and experience obtained in evaluating and designing visualizations
....
4. Important dates

Proposal due:  February 24, 2012  (Proposal has no length limits, usually should include motivations, method, contributions and a brief outline of the full chapter)
Notification: March 09, 2012
Full chapter due: June 15, 2012
Full manuscript due to publisher: August 1, 2012
Book publication: October 1, 2012

5. Contact

All submissions and inquiries should be sent to:
Tony Huang
CSIRO ICT Center, Australia
Email: whua5569 AT gmail.com

Wednesday, 25 January 2012

Scope, Space, Nursing, Informatics: Fusion II (care)

After Paolo Perrotta (see post January 20, 2012):

and Paolo Perrotta, (2010). Metaprogramming Ruby, The Pragmatic Bookshelf. p.75.


Imagine being a care coordinator making sense and sense making (Dervin, 2005) your way through a new health and social care referral: here is the care program(me) approach. You jump from care problem, to strength, to further assessment question ... until the care domain priority is resolved. A decision point. That's the initial scope (and in an urgent / crisis situation this is resolved in an instant).

The scope is not defined in a single program, but several in parallel. This is why health and social care is often described as complex. You find yourself in a complex. At this decision point you are at the center of a range of local variables.
You can see bindings all over the scope. p.75.
There are assumptions, hypotheses and bits of data yet to be fully apprehended. It's hard but vital to be aware of what is objective and what is subjective. Why?
Raise your head, and you see that you're standing within an object,
[ a very special object ]
with its own methods and instance variables; that's the current object, also known as self. p.75.
To your immediate left and forward there are instance variables: beliefs, choices, motivation, aspirations, memories ... and the unique ability of this self to use its methods to communicate and interact with other selves, the world and future. You notice a problem. Many of the methods you might expect are not intact. There is a problem with the capacity of memory. Where there should be several parameters in sequence: there is. One. This may even then be lacking. Reading and writing is a problem here.

To the right and forward there is a monthly weight chart, a medication administration chart, BP and pulse are also recorded. There is a history of falls, a fractured femur, and bruising. There is a diagnosis - an inguinal hernia. Two postcodes have you momentarily perplexed. Ah, one is static 'home'; the other is current location and that's a close to home telecare mediated match.
 
Turning first to your right and over your shoulder there is an issue with care management and wandering at night: a vulnerability for this person. Another instance variable then flags mental capacity for a that hernia which needs repair. Respite care vouchers have been issued, but the year's allocation remain unused.

Next, turning around to your left there are details of next of kin and the fact that the carer involved is under a great deal of stress.
Further away, you see the tree of constants so clear that you could mark your current position on a map. p.75.
You are in fact encircled by a series of official identifiers. First at 10 o'clock two first names - these are the names that are given. The names for the person, the individual who is the focus of the referral. At two o'clock a key event for this individual their DOB - date of birth. At four o'clock the digits of the NHS number and a local case record number are captured. Completing the "Full name" at 8 o'clock you find a surname, the family name. It's double-barreled too. An explicit effort to preserve and extend family history and lineage.
Squint your eyes, and you can even see a bunch of global variables off in the distance. p.75.
Global variables.
What lies behind them?

It sounds strange to describe the person as an object, even if the context alludes to informatics.
To confirm this object is special. When you think about it though this object, the patient, the person, the individual, this self has a partner: the healthcare professional.

When we say that positive, high quality care values are global that makes sense. They should be: globally. To say they are variable seems to invite poor quality care, slack standards, inequality, inequity. Acknowledging that standards do vary can help ensure vigilance and that high quality care remains the key aspiration for new learners and experts alike. Nursing and other values are then a global variable that need constant attention and governance.

Friday, 20 January 2012

Scope, Space, Nursing, Informatics: Fusion I

Paolo Perrotta writes:
Imagine being a little debugger making your way through a Ruby program. You jump from statement to statement until you finally hit a breakpoint. Now, catch your breath and look around. See the scenery around you? That's your scope.

You can see bindings all over the scope. Look down at your feet, and you see a bunch of local variables. Raise your head, and you see that you're standing within an object, with its own methods and instance variables; that's the current object, also known as self. Further away, you see the tree of constants so clear that you could mark your current position on a map. Squint your eyes, and you can even see a bunch of global variables off in the distance. p.75.

Paolo Perrotta, (2010). Metaprogramming Ruby, The Pragmatic Bookshelf.