Showing posts with label synthesis. Show all posts

Thursday, 1 May 2014

Wellbeing: A Complete Reference Guide

Several years ago well-being was everywhere so it seemed. I even blogged about this wondering about the professional side of caring and the care professions:

Well-being and the dilution of 'caring'

What triggered the reflections above in 2010 was the appearance of the British Journal of Wellbeing (BJW). I subsequently learned that the journal launched in April 2010 was published until the end of 2011; the publisher (MA Healthcare) then launched a new journal the British Journal of Mental Health Nursing (BJMHN). I was also advised that although BJMHN has some similarities to BJW, it has more of a nursing focus. 

So, perhaps there was some merit in my thoughts back in 2010 and yet well-being (or wellbeing) is a central discussion point. It has to be if we are to conjoin:

health education : health care 
'being' - 'well' (physically, mentally, ....)
self care : care services
health literate - health 'expert' / professional
.....

I now wonder if the scope of the volumes in a complete reference guide on wellbeing as indicated below, might benefit from an overarching conceptual framework?
This reference set comprises six volumes that focus on the ways wellbeing has been studied and can be applied across different aspects of the life course.
  • The first multi-volume examination of all elements of wellbeing.
  • Volumes cover children and families; the workplace; the environment; aging and later life; economics; and policies of wellbeing
  • Each volume brings together leaders of their respective fields in an edited volume of original articles
  • Presents a synthesis of the latest research on this growing and interdisciplinary area of study
Wellbeing: A Complete Reference Guide
Edited by Cary L. Cooper, CBE
Distinguished Professor of Organizational Psychology and Health at Lancaster University, UK
Now available in print and online
6 volumes • 3,000 pages • Hardcover
Print Edition ISBN: 978-1-118-53882-1


* 
Personal communication: Sam Gournay
Sent: Wednesday, 20 March 2013, 11:30
Subject: FW: Message from MA Healthcare website

Thursday, 20 March 2014

[c/o hipnet] Data Visualization Enthusiast? Join us on the Data Viz Hub!

Dear Colleagues

The recently launched Data Viz for Development Hub [http://datavizhub.co] is a vibrant community for sharing resources, tools, examples, and ideas about data visualization. Using graphs, charts, maps, tables, infographics, and other visualizations can improve how we communicate information to stakeholders and the larger development community. With a wealth of resources available, and a growing interest across international development practitioners to build effective visualizations, the Hub will help keep communicators, evaluators, developers and others in the know about data viz best practices and new tools, connecting visualizers from all domains of expertise.

Check out the Hub at datavizhub.co, and join the community listserv by emailing:
dataviz AT knowledge-gateway.org with the subject "Join." We look forward to connecting with you about all things data viz!

Questions? Contact Libby Skolnik at libby.skolnik AT jhu.edu

Source: http://www.hipnet.org/

Saturday, 1 March 2014

Drupalcamp London 2014: The Government Digital Service, Drupal 8 Multilingual features, Twig

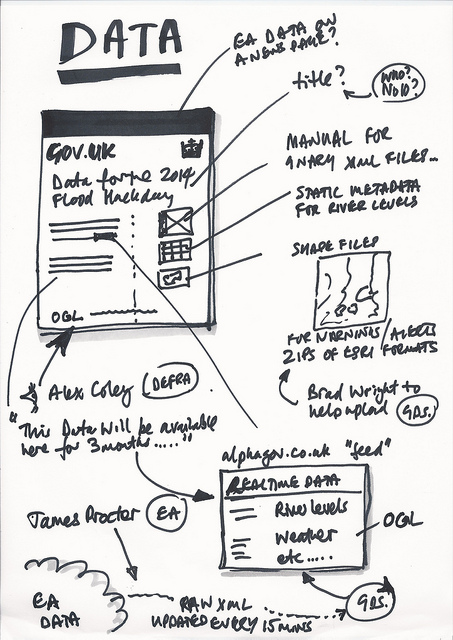
https://gds.blog.gov.uk/2014/02/23/flood-hack-developing-solutions/
Flood hack
DrupalCamp London today got underway with a keynote Delivering User-centred Digital Services by Mark O'Neill from the UK Government Digital Service.

Given the record of public and private sector led IT projects it was refreshing to hear of the GDS's approach being user-centred, the extension of 7 design principles and Mark's previous experience. It's clearly too late for the health care sector to coin and create the Needotron - GDS beat us to it.

Drupal 8 is looking formidable both in its potential and the (learning) stack it presents. Another great session to pick out was - A whole new world for multilingual sites in Drupal 8 by Gábor Hojtsy. The progress here is phenomenal and even though incomplete it is a major achievement and a credit to the Drupal community.

It's humbling as it reminds me to post some introductions to Hodges' model on W2tQ in several languages.

As to being user-centred, the Harmony Forum is a real tease. I know a forum will not moderate itself (is that the new Sorcerer's Apprentice?) and yet time is of the essence. Harmony is one for me to watch - so I'm signed up for the newsletter. Two sessions on Twig and Entities rounded up a busy few days.

This began on Thursday with Cutty Sark, the Royal Greenwich Observatory (learned much from their interactive designs), Turner and the Sea, The British Library - Beautiful Science (60-90 mins ample), and Ibsen's Ghosts at Trafalgar Studios.

I was also able to visit a university yesterday and meet a member of faculty who used Hodges' model many years ago. Here's hoping that some of the materials can be retrieved even though it seems unlikely. I hope to keep in touch with this nursing contact (and not just for the dinner!). I've met several other people here, the Drupal community is another great asset - and with thanks to the sponsors who make these events feasible for many of us.

Output from Needotron


I'll end this post back with Mr O'Neill and the GDS.

I wonder to what extent healthcare figured in the flood deliberations?

It seems that an output from the Needotron may not be so far removed from h2cm?

Happy St David's Day too - in the closing minutes here!


Saturday, 13 April 2013

Evidence Network Newsletter [II]

I posted about this over two years ago. Here is a revisit, prompted by the arrival of the April Evidence Network e-Newsletter c/o Alan Gomersall at the Centre for Evidence & Policy, King’s College London:
Founded in 2001 as part of an ESRC-funded initiative, the Evidence Network is an information resource aimed at anyone concerned with evidence-informed policy and practice (EBPP) in the broad field of social and public policy.
You have to join but it is very worthwhile for those as noted above.

This issue includes an invitation for submissions to the Research Synthesis Methods Journal:
... Papers may address any aspect of research synthesis, including information retrieval aspects such as searching for studies to incorporate into evidence syntheses such as systematic reviews, health technology assessments and guidelines.
Papers on topics in fields such as the health and social sciences are welcome if they can also demonstrate relevance to general research synthesis.  Papers reporting the results of a particular research synthesis are not, however, appropriate unless the focus is exclusively on an innovative or instructive methodological feature.  To promote widespread dissemination that will enhance methodological innovation and synthesis practice, the articles in this journal must be accessible to a broad and interdisciplinary audience. ...
In addition there's a new website for The Alliance for Useful Evidence, systematic reviews, information for practice and much more across seven-eight pages.

Monday, 3 December 2012

The Difference that Makes a Difference 2013 - Information: Space, Time, and Identity


You are invited to The Difference that Makes a Difference 2013, An interdisciplinary workshop on Information: Space, Time, and Identity.

Location: The Open University and the MK Gallery, Milton Keynes , UK
Dates: 8-10 April 2013
Website: http://www.dtmd.org.uk

Deadline for one page abstracts - 3rd January 2013.

Information has been conceptualised in many different ways in different disciplines, and the DTMD series of workshops is a forum for sharing of those insights . We are keen to involve as many different people, from as many different disciplines, as possible in presenting and participating in the workshop. We invite a wide range of participants to give short (10 minute) presentations on their work as it relates to an understanding of information.

There will be six sessions:

Over days 1 and 2 the first four sessions consist of a keynote speaker followed by six or seven short presentations (which will have been selected by referees from submitted abstracts) then a panel discussion.
  1. Information and Space. The relationship between information and space, 'meaning' in our physical environment, and the information landscapes that go beyond physical space.
  2. Information and Time. Both the historic framework of the notion of information, and time as a 'dimension' in information – physics, entropy, information and ‘the arrow of time’.
  3. Information and Identity. Identity (race, gender, nationality, class and sexual orientation, for example) as information and, conversely, information as identity.
  4. What is information? Why are so many disciplines using informational concepts in their narratives? Is a Universal Theory of Information (UTI) possible?
Sessions 5 and 6 on day 3 draw together the insights from the first two days in two ways. First, through art, when the results of the work of the Workshop artist’s collaboration with delegates is presented and discussed. Second, a final keynote speech from Luciano Floridi, Professor of the Philosophy of Information will lead in to a panel discussion with the keynote speakers from the earlier sessions.

For more details see the workshop programme: http://www.dtmd.org.uk/programme and the Call for Papers: http://www.dtmd.org.uk/call-for-papers

Accepted abstracts will be published in a Workshop Digest which will be made available online prior to the event, and, following the workshop, delegates will be invited to submit papers for special issue of Kybernetes, based on papers presented at the workshop.

We hope to see you in Milton Keynes in April.
Best wishes,
Magnus Ramage and David Chapman on behalf of the Programme Committee: http://www.dtmd.org.uk/committee
-- 
Dr. David A. Chapman CEng, FIET, FHEA
Senior Lecturer
Department of Communication and Systems
The Open University http://cands.open.ac.uk/
Intropy blog: http://www.intropy.co.uk/
T. +44 1908 652919 Twitter @dachapman

Sunday, 2 December 2012

FatFonts - fonts with real weight: Giving space and data form

How it works (from fatfonts.org):

Fatfonts are designed so that the amount of dark pixels in a numeral character is proportional to the number it represents. For example, “2″ has twice the ink than “1″, “8″ has two times the amount of dark ink than “4″ etc. You can see this easily in the set of characters below:


Source for the above and animated: http://visual.ly/fatfonts-player?view=true

My source: Jacob Aron, Making numbers punch their weight, New Scientist, 5 May 2012, 214, 2863, p.12.

Saturday, 1 September 2012

April 8-10 2013 The Difference That Makes a Difference: Information - People and Places

To: DTMD2011 contacts
Dear colleague,

We are sending you this message because either you attended The Difference That Makes a Difference 2011 workshop (www.dtmd2011.info) last September, or we have previously had some other contact with you in association with the workshop, and we think this information will be of interest to you.

 DTMD 2013

Plans for "The Difference That Makes a Difference 2013" are taking shape. It will run from 8th to 10th April 2013 and will either be on the Open University campus or, if we can get the funding, at Bletchley Park. There will be an overall theme to the workshop of 'Information: People and Places', with the sessions provisionally planned as follows:
Session 1: The philosophy of information and the search for a UTI. This does not specifically address the people and places theme, but addresses the underlying theoretical basis running through all discussions of Information.

Session 2: Information and Identity: How does thinking in terms of information inform our understanding of human identity? How do our concepts of identity inform our understanding of information? What do we learn if we address race, gender, nationality, class, sexual orientation as information issues?

Session 3: Information and the built environment. In what sense is architecture an information discipline? What is the relationship between information and cities.

Session 4: Information and Geography. This opens the themes of sessions 2 and 3 to a broader consideration of information in the context of physical and human geography. As with DTMD 2011, these sessions will be followed by a synthesis session to maximise the opportunity for discussion. 
An additional exciting plan for DTMD 2013 is the involvement of artists. We have been in discussion with the MK Gallery and are seeking funding to allow three artists to participate in the workshop, and at the end of the workshop for one them to be commissioned to produce a work which reflects, interprets and communicates ideas emerging from the workshop. The commissioned work would be unveiled/launched/performed six months after the workshop.

We are very pleased that Professor Luciano Floridi (http://www.philosophyofinformation.net/Welcome.html) has agreed to participate in the workshop.

Please get in touch if you have any proposals or suggestions for DTMD 2013 - and put it in your diary.

TripleC Special Issue. We've had a good set of papers submitted for the special issue of TripleC arising from DTMD 2011, which we are currently reviewing. The Special Issue is planned for August this year - keep an eye on the website: www.triple-c.at.  

Kybernetes. We (Magnus and David) together with Chris Bissell (Professor of Telematics at the OU, and one of the Keynote Speakers at DTMD 2011) are to take up the editorship of Kybernetes (http://www.emeraldinsight.com/journals.htm?issn=0368-492X ) from later this year, with Magnus as lead editor and David and Chris as co-editors. Among our plans for the journal are to increase the focus on Information. Again: keep an eye on the website.

Best wishes,
David Chapman and Magnus Ramage

Dr. David A. Chapman CEng, FIET, FHEA
Senior Lecturer
Department of Communication and Systems
The Open University
http://cands.open.ac.uk/
Intropy blog: http://www.intropy.co.uk/
Twitter @dachapman

http://www.dtmd2011.info/announcements/newsapril2012

Saturday, 4 August 2012

IdN Extra 07: Infographics — Designing Data

Visiting Manchester twice this past fortnight I'd noticed this IdN special issue on infographics in the Cornerhouse shop. The shop's only small but there is lots to dive into - arts, media, design and philosophy.

When a database becomes a thing of beauty

Infographics or information graphics are visual representations of information, data or knowledge. They are often used when complex information needs to be presented as quickly and effectively as possible, such as signs and maps. Infographics can be as simple as a bar chart or a pie graph to represent percentages in business information; or as elaborative as some of the examples in this book to communicate stories in newspapers and magazine.

Infographics can be entertaining when the information they represent is of personal interest; but it is especially fun and challenging when the topic may be as dry as representing concepts in technical manuals or scientific statics.

 <->

I don't know if it's the reduced scale, or my right eye talking but some of the text descriptions are difficult to read. The graphics and ideas are stunning, both in themselves and the questions they provoke.

Wednesday, 20 June 2012

Visual Methodologies Workshop in Newcastle

After Oxford Drupal Education Camp this Friday-Saturday proceedings move on to a NE workshop.

If your focus is on person-centered health care then the volume of data involved that pertaining to the individual can be readily apprehended. At least the example of a single episode of care. Of course, there are exceptions, people who might be the subject of special case studies so complex is their condition and pathology. Data volumes do vary markedly from person to person. A great deal of generated data in an individual instance might be taken for granted. In the reported findings, for example, of an MRI scan that is included in a referral. When provided existing diagnoses do much to enrich the information and knowledge contained in a referral, whilst reducing possible avenues for further data gathering.

Once we move from individuals to groups and populations then the volumes involved quickly become massive. Purposes and context reflect this change in scale; codified, anonymised, aggregated the individual is lost.

Both my day-to-day work and study of Hodges' model (in nursing, informatics, literacy...) are centered on individuals. 'Caseness' in a clinical word: a referral, home visits for the day, face-to-face interaction, care concepts in assessments, plans. ... Then there is envisioning a nurse-patient (carer) interaction, or individual's episode of care through Hodges' model. As per the model's structure, however, groups and populations must also be represented. This duality of personal and data scales makes this workshop on visual methodologies of instant relevance. The two days next week cover (with my emphasis):
Introduction to working with visual methodologies: understanding epistemologies and disciplinary boundaries
  • Mapping
  • Story-boarding
  • Artefacts
Quality in visual methods: ethics, validity and reliability
Doing visual methods: lived examples of managing data capture, synthesis, analysis and dissemination
Modes of analysis: focusing on methodological and epistemological influence on the research process

Workshop part 1: working with self-created data
Workshop part 2: creating shared analytic frameworks for self-created data
Overarching ideas and ways forward for thinking about visual methodology
Hodges' model can be readily interpreted and presented as a map and a series of story boards. The model can also support analysis, synthesis: well, this is my belief that is shared by some people.

I have completed modules on research methods, but it seems increasingly that research methods, methodologies, data structures and algorithms overlap. It may be that advances in media, technology, data gathering and improved access to data sets is having this effect. Perhaps more integrative and open attitudes (interdisciplinarity) towards quantitative and qualitative research also accounts for this blurring; or it could just be me? Whatever is the case, I'm really looking forward to the programme, meeting the facilitators and students. I am hoping this will inform my project as per the aims of the workshop:
  • Consider the role of visual methods in data collection, research ethics, synthesis, analysis and dissemination;
  • Explore the theoretical prospectives, epistemological traditions and latest practices that have shaped the development of visual methodologies; and
  • Enable participants to translate how visual methodologies can be used to support their own research.
I'll try and post from Oxford this Friday - Saturday and from Newcastle next week. From Newcastle I'll be heading to Edinburgh for the Scottish Ruby Conference. Lots to follow as I put 10 days unpaid leave to use.

Wednesday, 16 May 2012

Visual means: Patient Status at a Glance (PSAG)

A recent HSJ came with a CHKS supported document on Top Hospitals. Page 14 considers Worldwide comparison and learning from others with three items on Patient Status at a Glance (PSAG) Boards; Developing a safety culture; and Reducing readmissions.

All are related (communication, safety, outcomes, multidisciplinary collaboration), but PSAG stands out to me for obvious reasons as it acknowledges the value of visual management, a quick heads-up overview of status. On PSAG four brief sentences note that South Tees Hospital NHS Foundation Trust in the UK has applied experience from Virginia Mason Medical Center in Seattle to develop PSAG in surgery.

Of course this application is focussed, being quite specific in the value of fewer nursing interruptions and a daily update for bed managers. This now contributes to making many wards more productive.

Hodges' model is a 'PSAG' of sorts, but it is more general, global in scope, summative. Perhaps it could act as a precursor to discharge?

Like the astronomer's blink comparator it could provide a before:after visual cue.

So, I wonder if Hodges' model could provide not only Patient Status upon Reflection, but Care Status upon Collective Reflection. This is vital at a time when we also need the patient and carers to be more productive in terms of supporting and sustaining their own care.


Thursday, 3 May 2012

Visual Methodologies Doctoral Training Workshop 26 - 27 June 2012

Developing Theory & Practice in Visual Methodologies


The School of Education, Communication & Language Sciences and Durham University’s School of Education are holding a two-day workshop for doctoral students on the development and use of visual methodologies.

The workshop will take place on Tuesday, 26 June and Wednesday, 27 June 2012 at Newcastle University.

Further information about the workshop and how to register can be found at:

http://www.dur.ac.uk/education/postgraduate/visualmethodologies/

The workshop is part of the North East Doctoral Training Centre’s (NEDTC) annual programme of advanced training in the social sciences.

Please do not hesitate to contact Anne Parks ( NEDTC Secretary email a.l.park AT durham.ac.uk ) if you need any further information about the event.

My source:
ESA-ALL at JISCMAIL.AC.UK

Wednesday, 28 March 2012

NIHR Public Health Research (PHR) programme - new funding opportunities


Researcher-led outline application form now available


The PHR programme is now accepting applications to its researcher-led workstream. In addition to applications under the normal remit, we are looking for applications under the following areas:

Highlight notices:
Applicants are invited to apply by 1pm on 30 July 2012.
To find out more about how to apply click here

Please tell others about us. We would be grateful if you could forward this email on to others within the public health field that may be interested in the funding opportunities presented by the Public Health Research programme. Where possible, please post this email on relevant websites and forums.

Contact us
tel: 023 8059 9695
email: info@phr.ac.uk
web: www.phr.nihr.ac.uk